
Sia

julia71211's Question
Macroeconomics
Posted 8 months ago
graph
nomınal weaıtn, and is the price ıevel. suppose that is constant and equal to .
a. In the table below compute the private sector's real wealth (M/P) and the intercept term of the AE function for each price level. (Round your responses to the nearest whole number.)
\begin{tabular}{ccc}
\hline Price Level & M/P & AE Function \\
\hline 2 & 12000 & \\
3 & 8000 & \\
4 & 6000 & \\
5 & 4800 & \\
6 & 4000 & \\
\hline
\end{tabular}
b. 1.) Use the line drawing tool two times to draw and label the functions that correspond to price levels 2 and 6.
2.) Use the point plotting tool to plot and label the equilibrium level of expenditures that correspond to price levels 2 and 6 .
Carefully follow the instructions above, and only draw the required objects.
It can be seen that a rise in domestic price level reduces private sector wealth, which leads to a fall in desired consumption, and thus a downward shift in the AE curve.
c. In the table below compute the level of equilibrium national income for each of the values of P. For example, when . Thus the equilibrium level of is such that , which implies . (Round your responses to the nearest whole number.)
\begin{tabular}{ccc}
\hline Price Level & AE Function & \begin{tabular}{c}
The level of \\
equillibrium
\end{tabular} \\
\hline 2 & & 10,000 \\
3 & & \\
4 & & \\
5 & & \\
6 & & \\
\hline
\end{tabular}
Aggregate Expenditure Function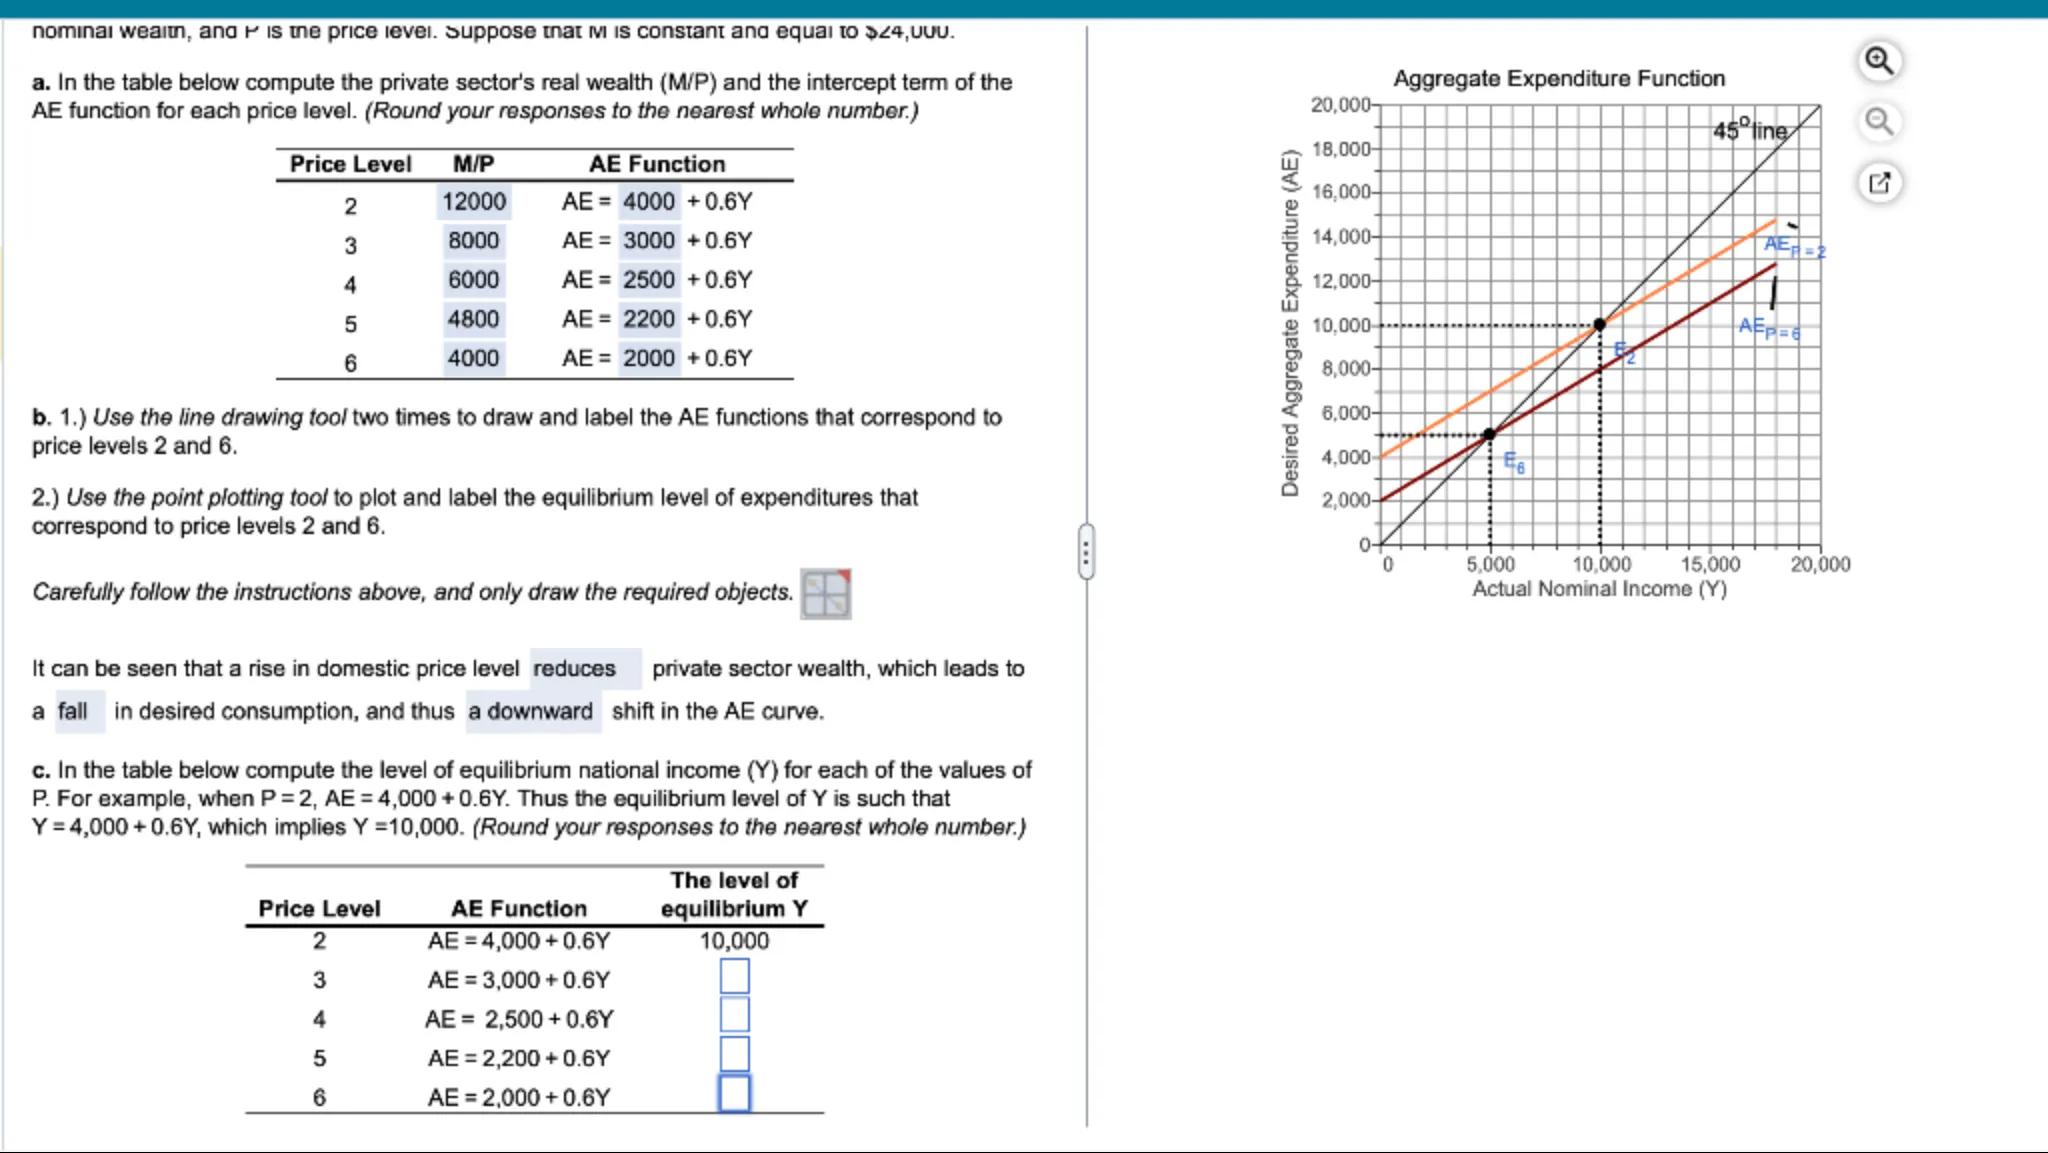
 Sign in to unlock the answer
Answer from Sia
Posted 8 months ago
Solution
a
To compute the private sector's real wealth (M/P) and the intercept term of the AE function for each price level, we use the given data. The formula for real wealth is , where is the nominal wealth and is the price level. The intercept term of the AE function is given directly in the table
b
To draw and label the AE functions that correspond to price levels 2 and 6, we use the given AE functions: and . These lines should be plotted on the graph with the x-axis representing Actual Nominal Income (Y) and the y-axis representing Desired Aggregate Expenditure (AE)
c
To compute the level of equilibrium national income for each of the values of P, we solve the equation for each AE function. For example, when , . Setting , we get . Solving for , we get . We repeat this process for each price level
Answer
The private sector's real wealth and the intercept term of the AE function for each price level are computed as follows:
- For : Real wealth = 12000, AE function =
- For : Real wealth = 8000, AE function =
- For : Real wealth = 6000, AE function =
- For : Real wealth = 4800, AE function =
- For : Real wealth = 4000, AE function =
The equilibrium national income for each price level is:
- For :
- For :
- For :
- For :
- For :
Key Concept
Real wealth and equilibrium national income
Explanation
Real wealth is calculated as nominal wealth divided by the price level. The equilibrium national income is found by setting the aggregate expenditure equal to national income and solving for .
Not the question you are looking for? Ask here!
Enter question by text
Enter question by image

Unlock Smarter Learning with AskSia Super!
Join Super, our all-in-one AI solution that can greatly improve your learning efficiency.
30% higher accuracy than GPT-4o
Entire learning journey support
The most student-friendly features

Study Other Question