
Sia

Question
Statistics
Posted 8 months ago
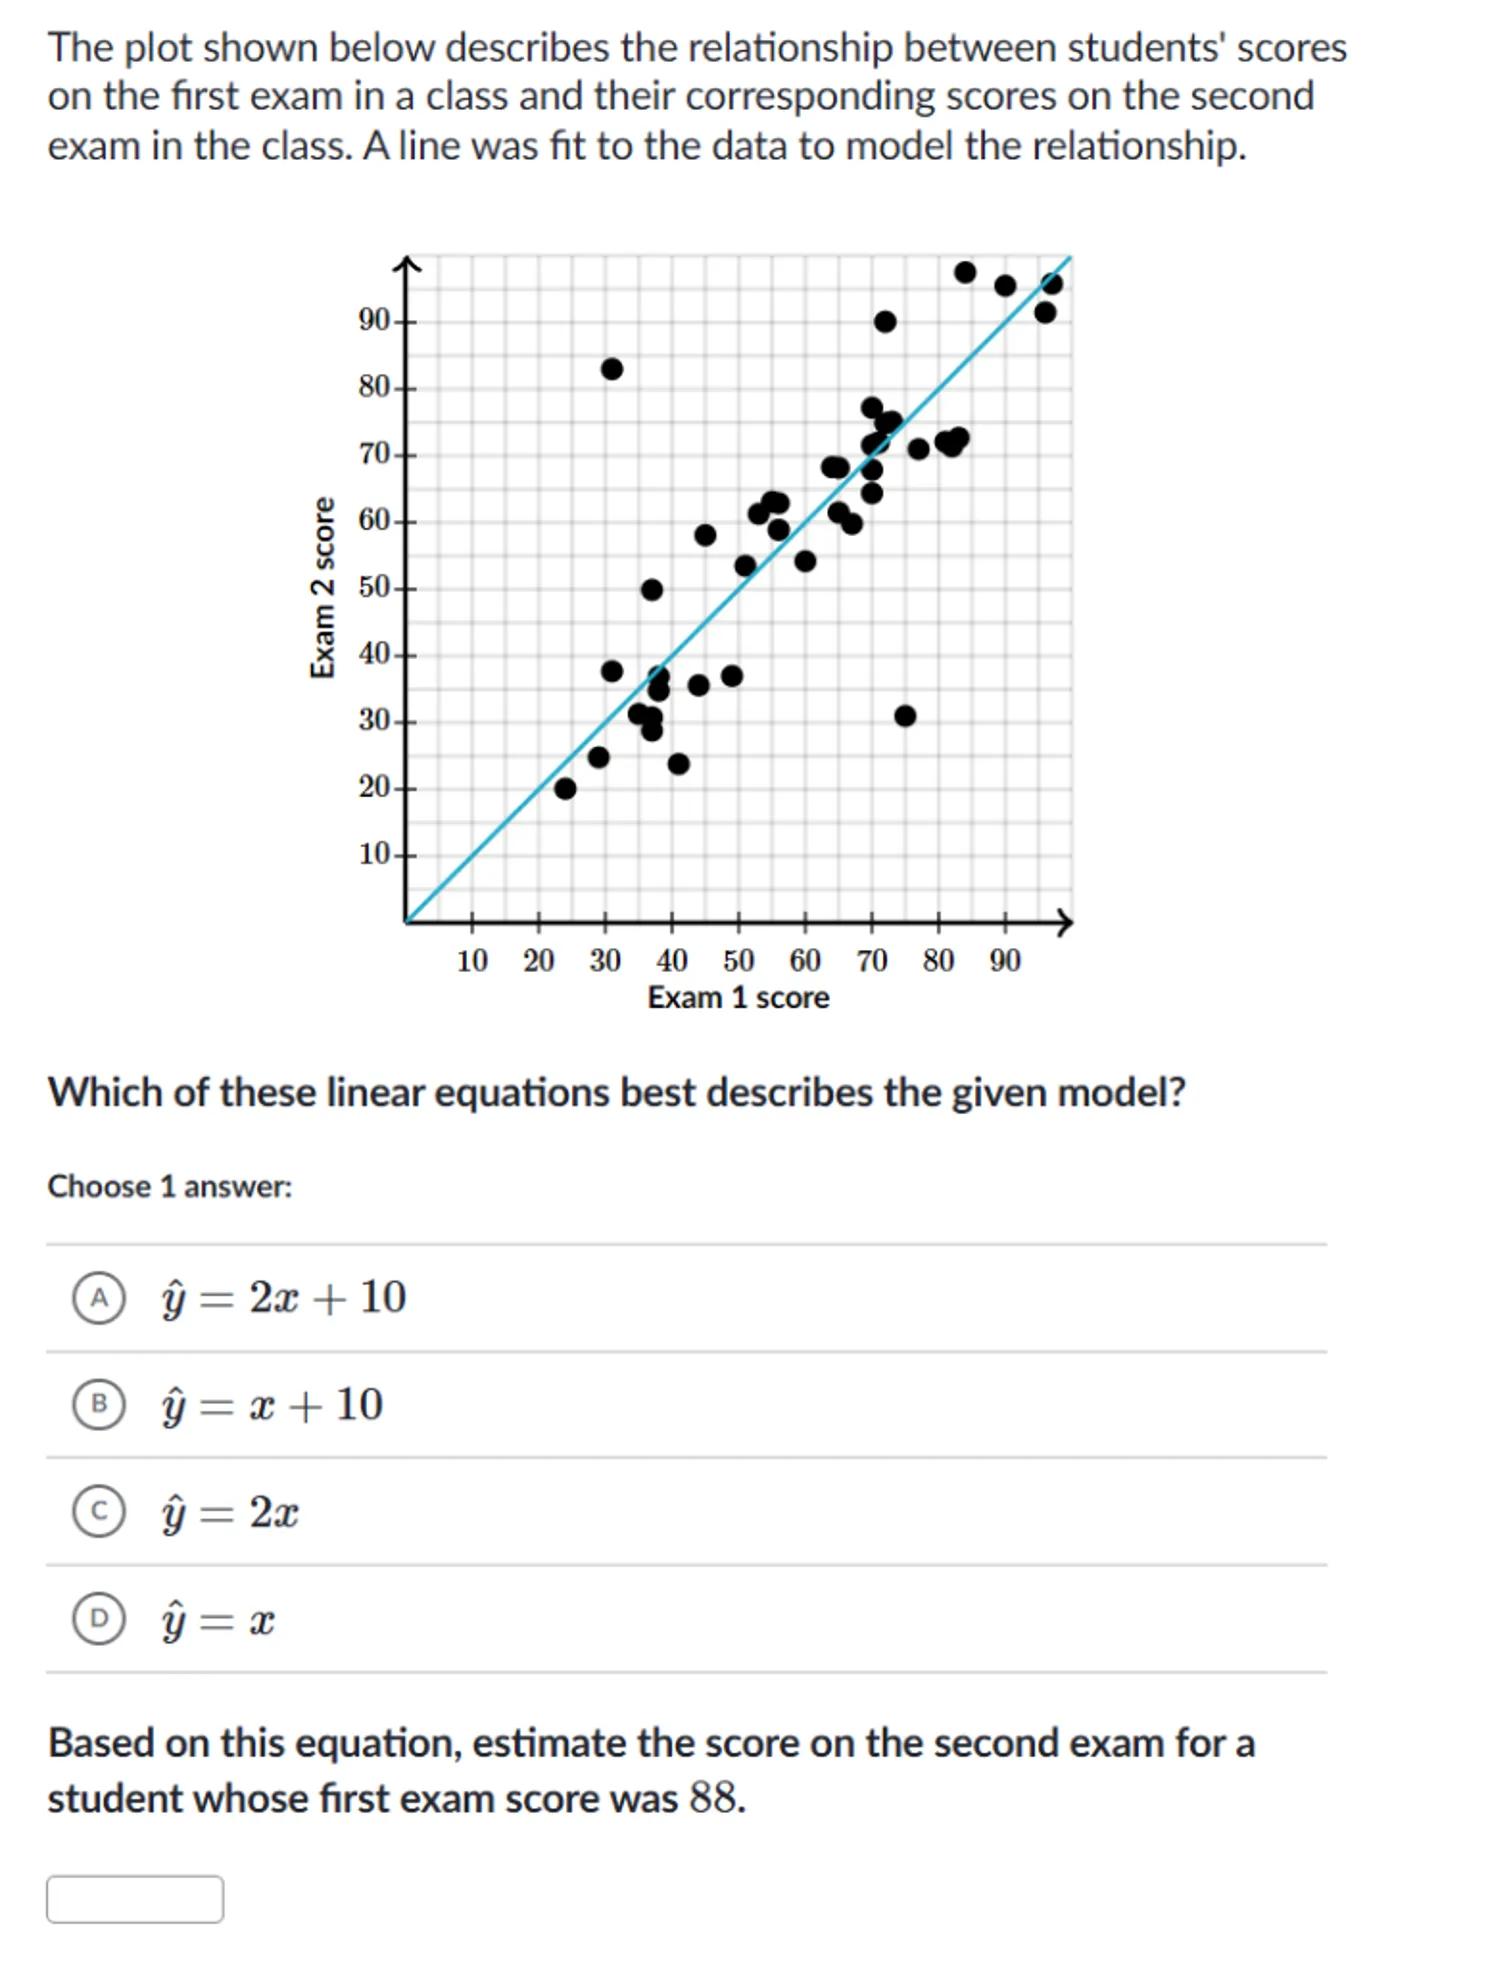
The plot shown below describes the relationship between students' scores on the first exam in a class and their corresponding scores on the second exam in the class. A line was fit to the data to model the relationship.
Which of these linear equations best describes the given model?
Choose 1 answer:
(A)
(B)
(c)
(D)
Based on this equation, estimate the score on the second exam for a student whose first exam score was 88 .
 Sign in to unlock the answer
Answer from Sia
Posted 8 months ago
Solution by Steps
step 1
To determine which linear equation best describes the given model, we need to compare the line of best fit in the scatter plot with the given equations. The line of best fit appears to pass through points around (20, 30) and (70, 80)
step 2
Let's test the given equations with these points. For (20, 30):
- For : (not a match)
- For : (match)
- For : (not a match)
- For : (not a match)
step 3
Now, let's test the point (70, 80):
- For : (not a match)
- For : (match)
- For : (not a match)
- For : (not a match)
step 4
Based on the points tested, the equation fits both points
B
step 5
To estimate the score on the second exam for a student whose first exam score was 88 using the equation :
Answer
Key Concept
Line of Best Fit
Explanation
The line of best fit is a straight line that best represents the data on a scatter plot. It can be used to make predictions based on the linear relationship between the variables.
Not the question you are looking for? Ask here!
Enter question by text
Enter question by image

Unlock Smarter Learning with AskSia Super!
Join Super, our all-in-one AI solution that can greatly improve your learning efficiency.
30% higher accuracy than GPT-4o
Entire learning journey support
The most student-friendly features

Study Other Question