
Sia

Question
Math
Posted 9 months ago
The continuous function is graphed.
We're interested in the area under the curve between and , and we're considering using Riemann sums to approximate it.
Order the areas from least (on top) to greatest (on bottom).
Actual area under the curve
Right Riemann sum
Left Riemann sum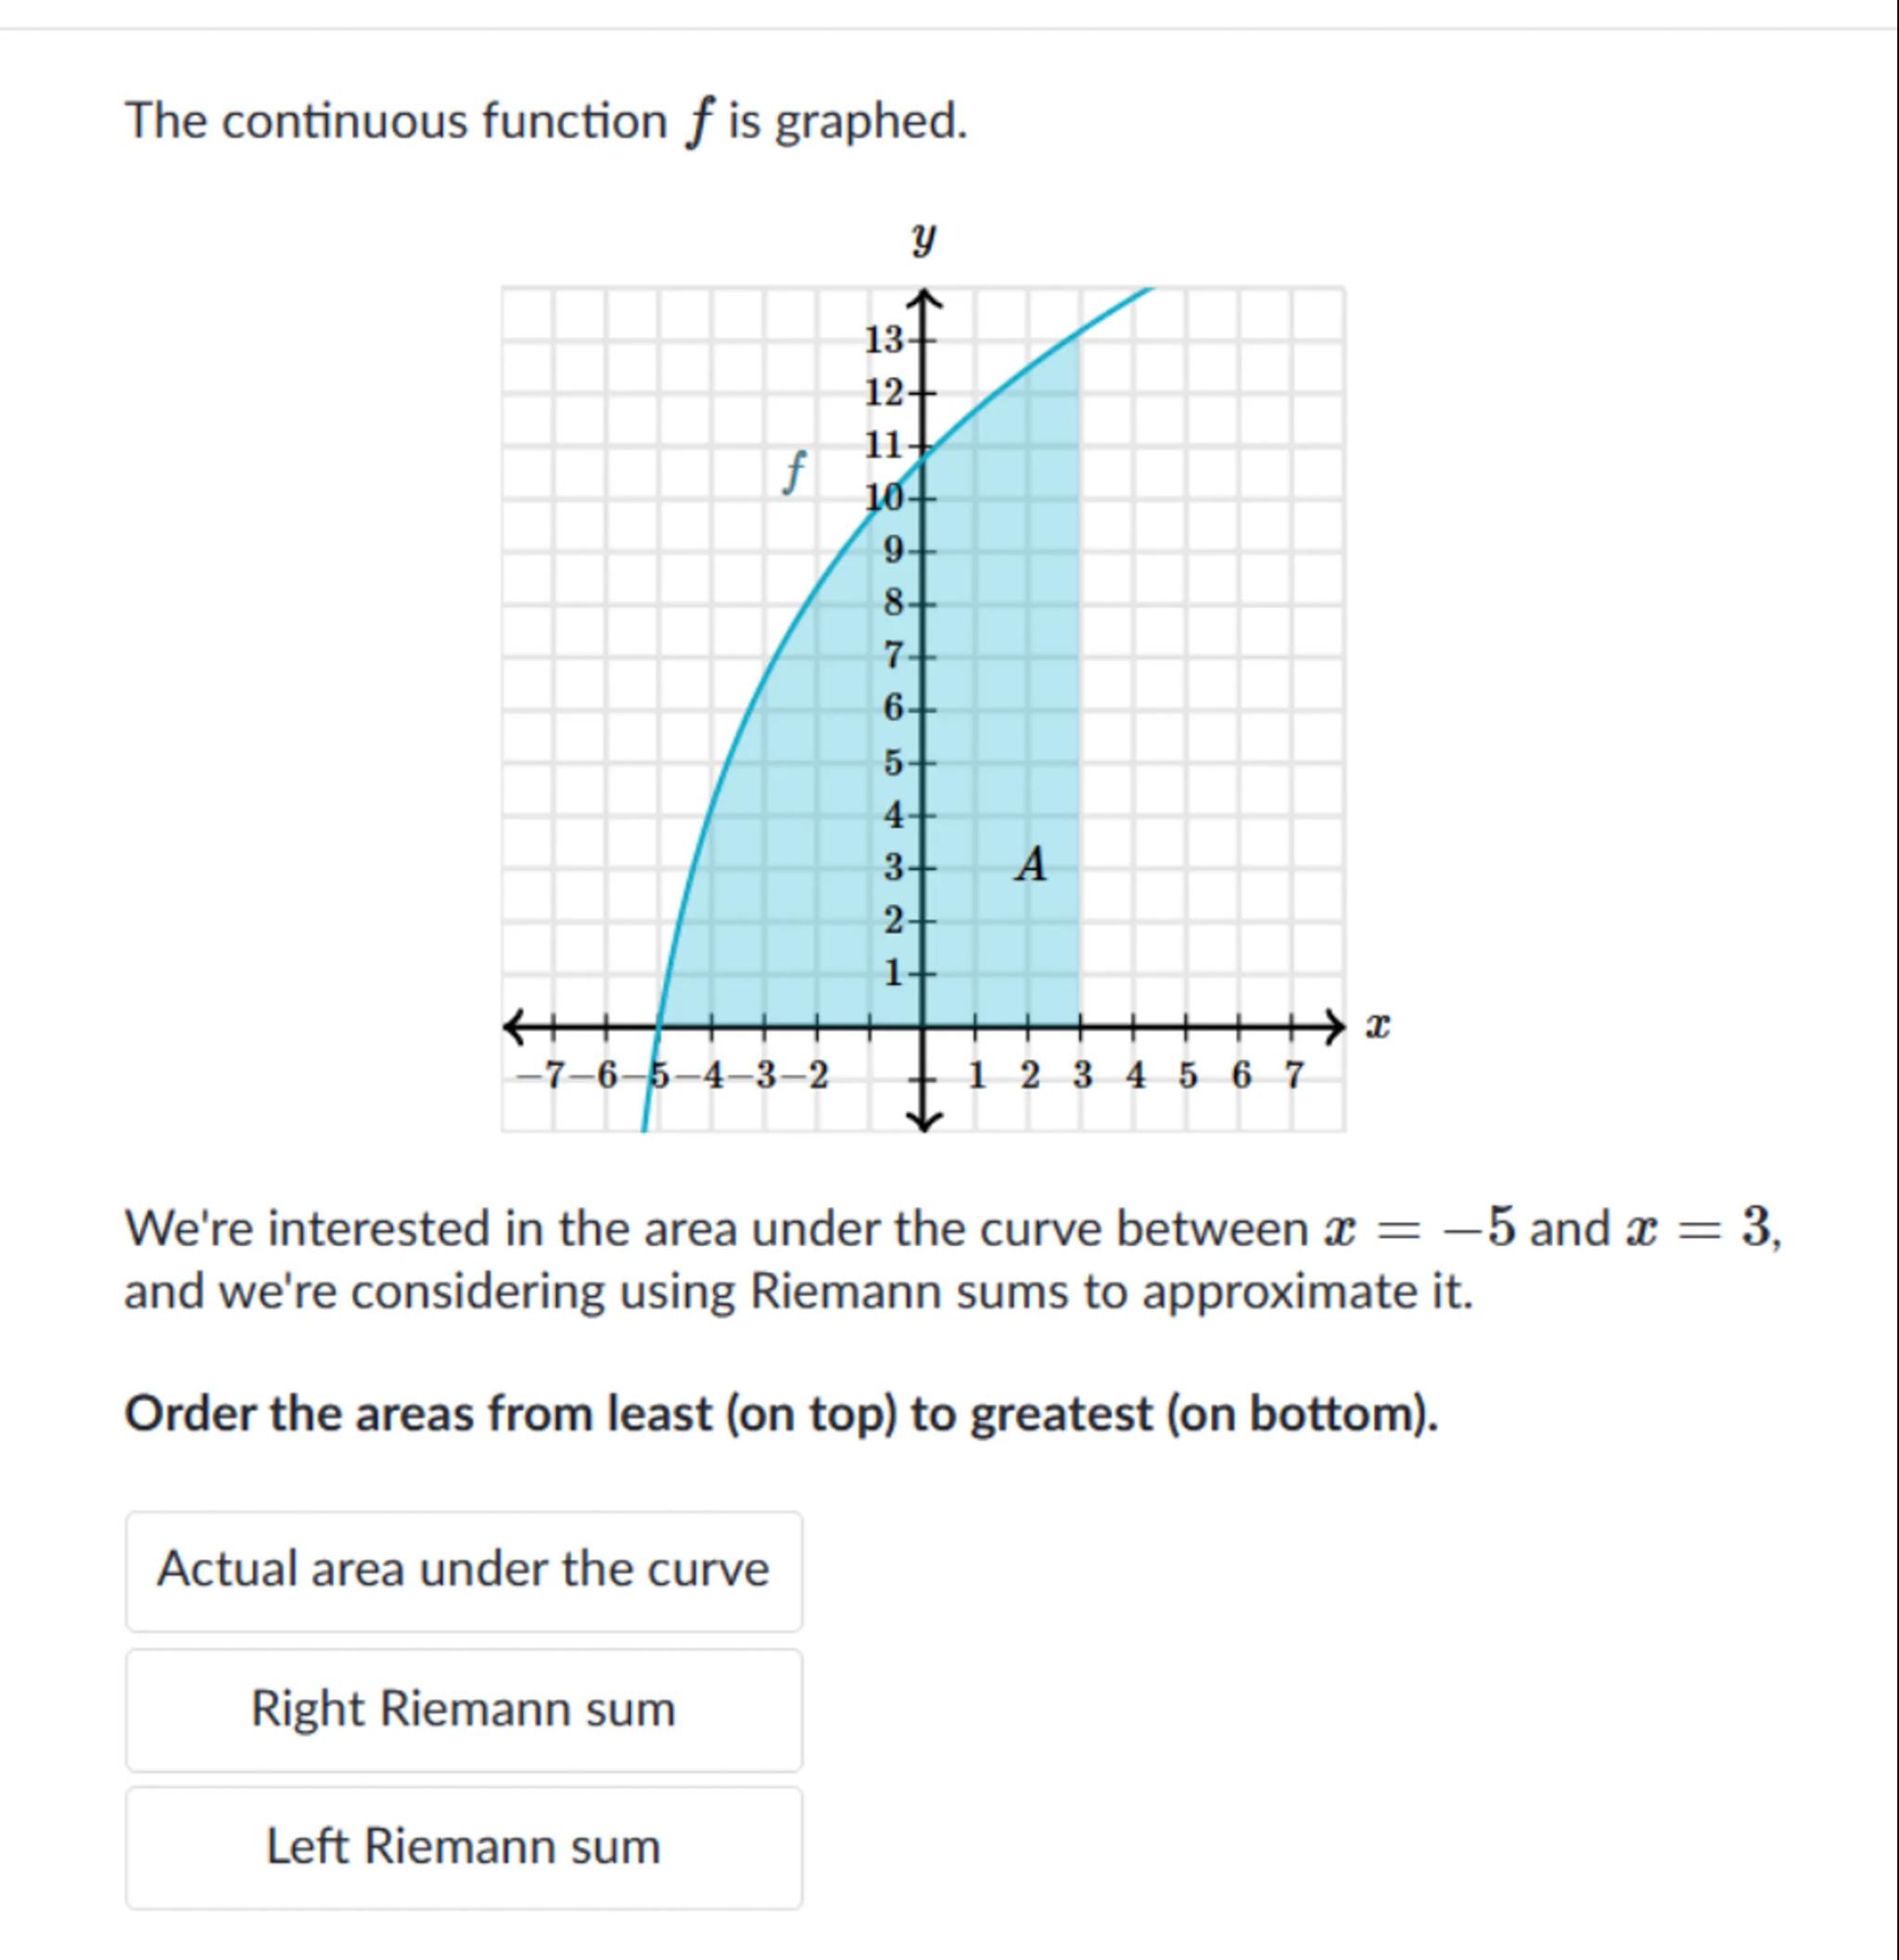
 Sign in to unlock the answer
Answer from Sia
Posted 9 months ago
Solution by Steps
step 1
To approximate the area under the curve between and using Riemann sums, we first need to understand the definitions of the left Riemann sum, right Riemann sum, and the actual area under the curve
step 2
The left Riemann sum approximates the area under the curve by summing the areas of rectangles whose heights are determined by the function values at the left endpoints of subintervals
step 3
The right Riemann sum approximates the area under the curve by summing the areas of rectangles whose heights are determined by the function values at the right endpoints of subintervals
step 4
The actual area under the curve is the integral of the function from to . This can be represented as
step 5
Typically, for a continuous and increasing function, the left Riemann sum will underestimate the area, and the right Riemann sum will overestimate the area. Therefore, the order from least to greatest is:
step 6
1. Left Riemann sum
step 7
2. Actual area under the curve
step 8
3. Right Riemann sum
Answer
Left Riemann sum, Actual area under the curve, Right Riemann sum
Key Concept
Riemann Sums
Explanation
Riemann sums are methods for approximating the total area under a curve on a graph, otherwise known as the integral of a function. The left Riemann sum uses the left endpoints of subintervals, while the right Riemann sum uses the right endpoints.
Not the question you are looking for? Ask here!
Enter question by text
Enter question by image

Unlock Smarter Learning with AskSia Super!
Join Super, our all-in-one AI solution that can greatly improve your learning efficiency.
30% higher accuracy than GPT-4o
Entire learning journey support
The most student-friendly features

Study Other Question