
Sia

Question
Math
Posted 10 months ago
In the year of the residents of the US moved to a different residence. Suppose that several census workers took random samples of residents from the population and computed the proportion of residents in each sample who had moved in 2012.
What would be the shape of the sampling distribution of ?
Choose 1 answer:
(A) Skewed to the left
B) Skewed to the right
(C) Approximately normal
D) Uniform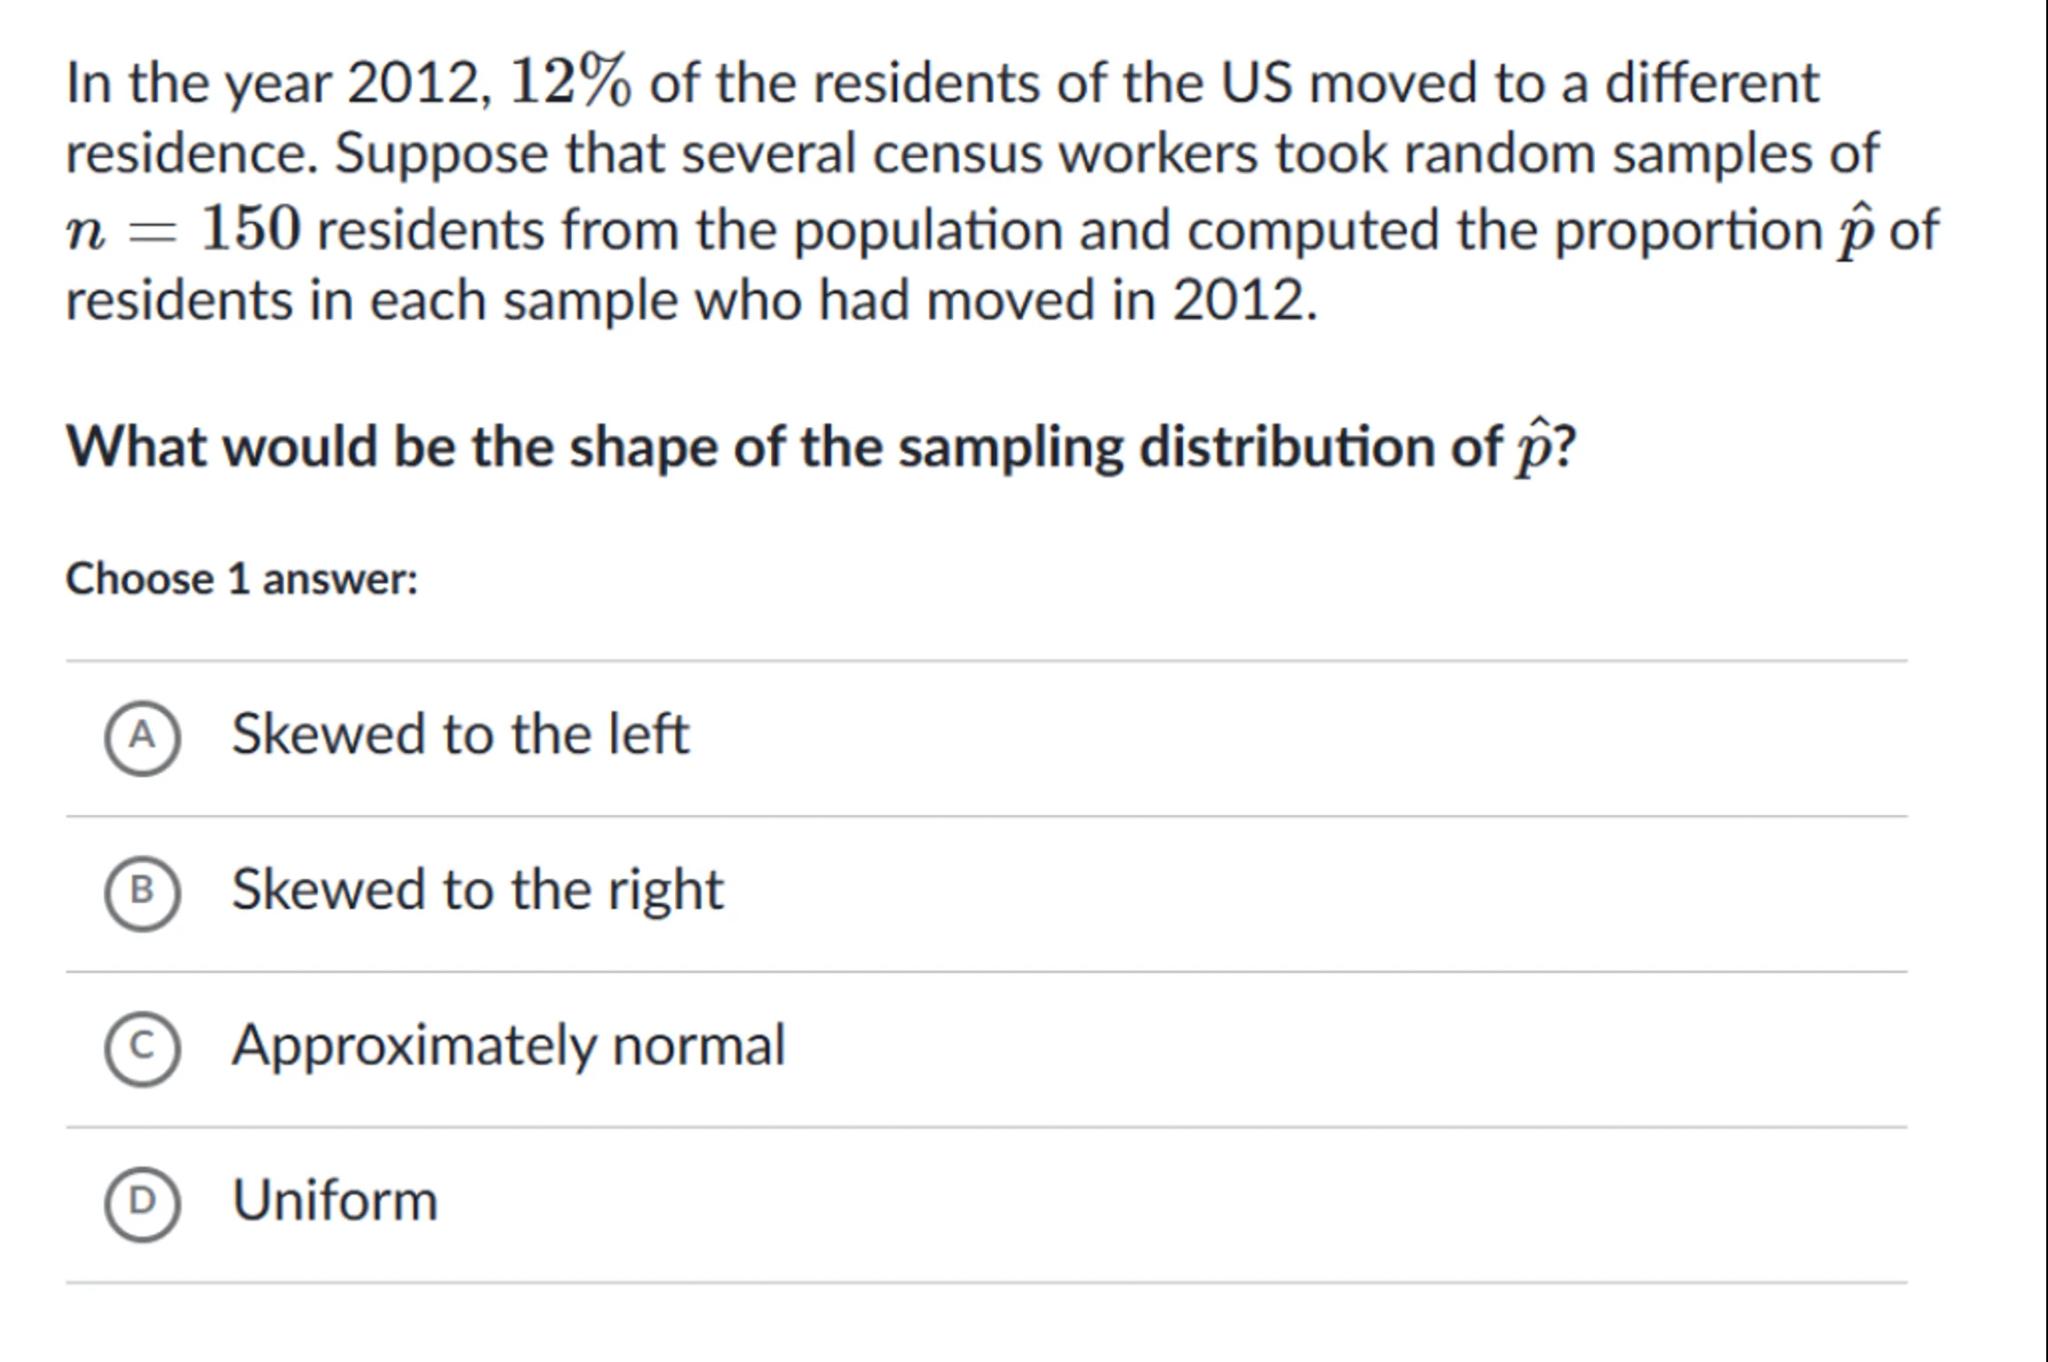
 Sign in to unlock the answer
Answer from Sia
Posted 10 months ago
Solution by Steps
step 2
The CLT states that for a sufficiently large sample size, the sampling distribution of the sample proportion will be approximately normal
step 3
Given that the number of trials and the probability of success , we can consider the sample size to be large enough for the CLT to apply
step 4
The mean of the sampling distribution is given by
step 5
The standard deviation of the sampling distribution is given by
step 6
Since the sample size is large (), the sampling distribution of will be approximately normal according to the CLT
C
Key Concept
Central Limit Theorem
Explanation
The Central Limit Theorem states that the sampling distribution of the sample mean (or proportion) will be approximately normal if the sample size is large enough, regardless of the population's distribution. In this case, with , the sampling distribution of is approximately normal.
Not the question you are looking for? Ask here!
Enter question by text
Enter question by image

Unlock Smarter Learning with AskSia Super!
Join Super, our all-in-one AI solution that can greatly improve your learning efficiency.
30% higher accuracy than GPT-4o
Entire learning journey support
The most student-friendly features

Study Other Question