
Sia

Question
Math
Posted 10 months ago
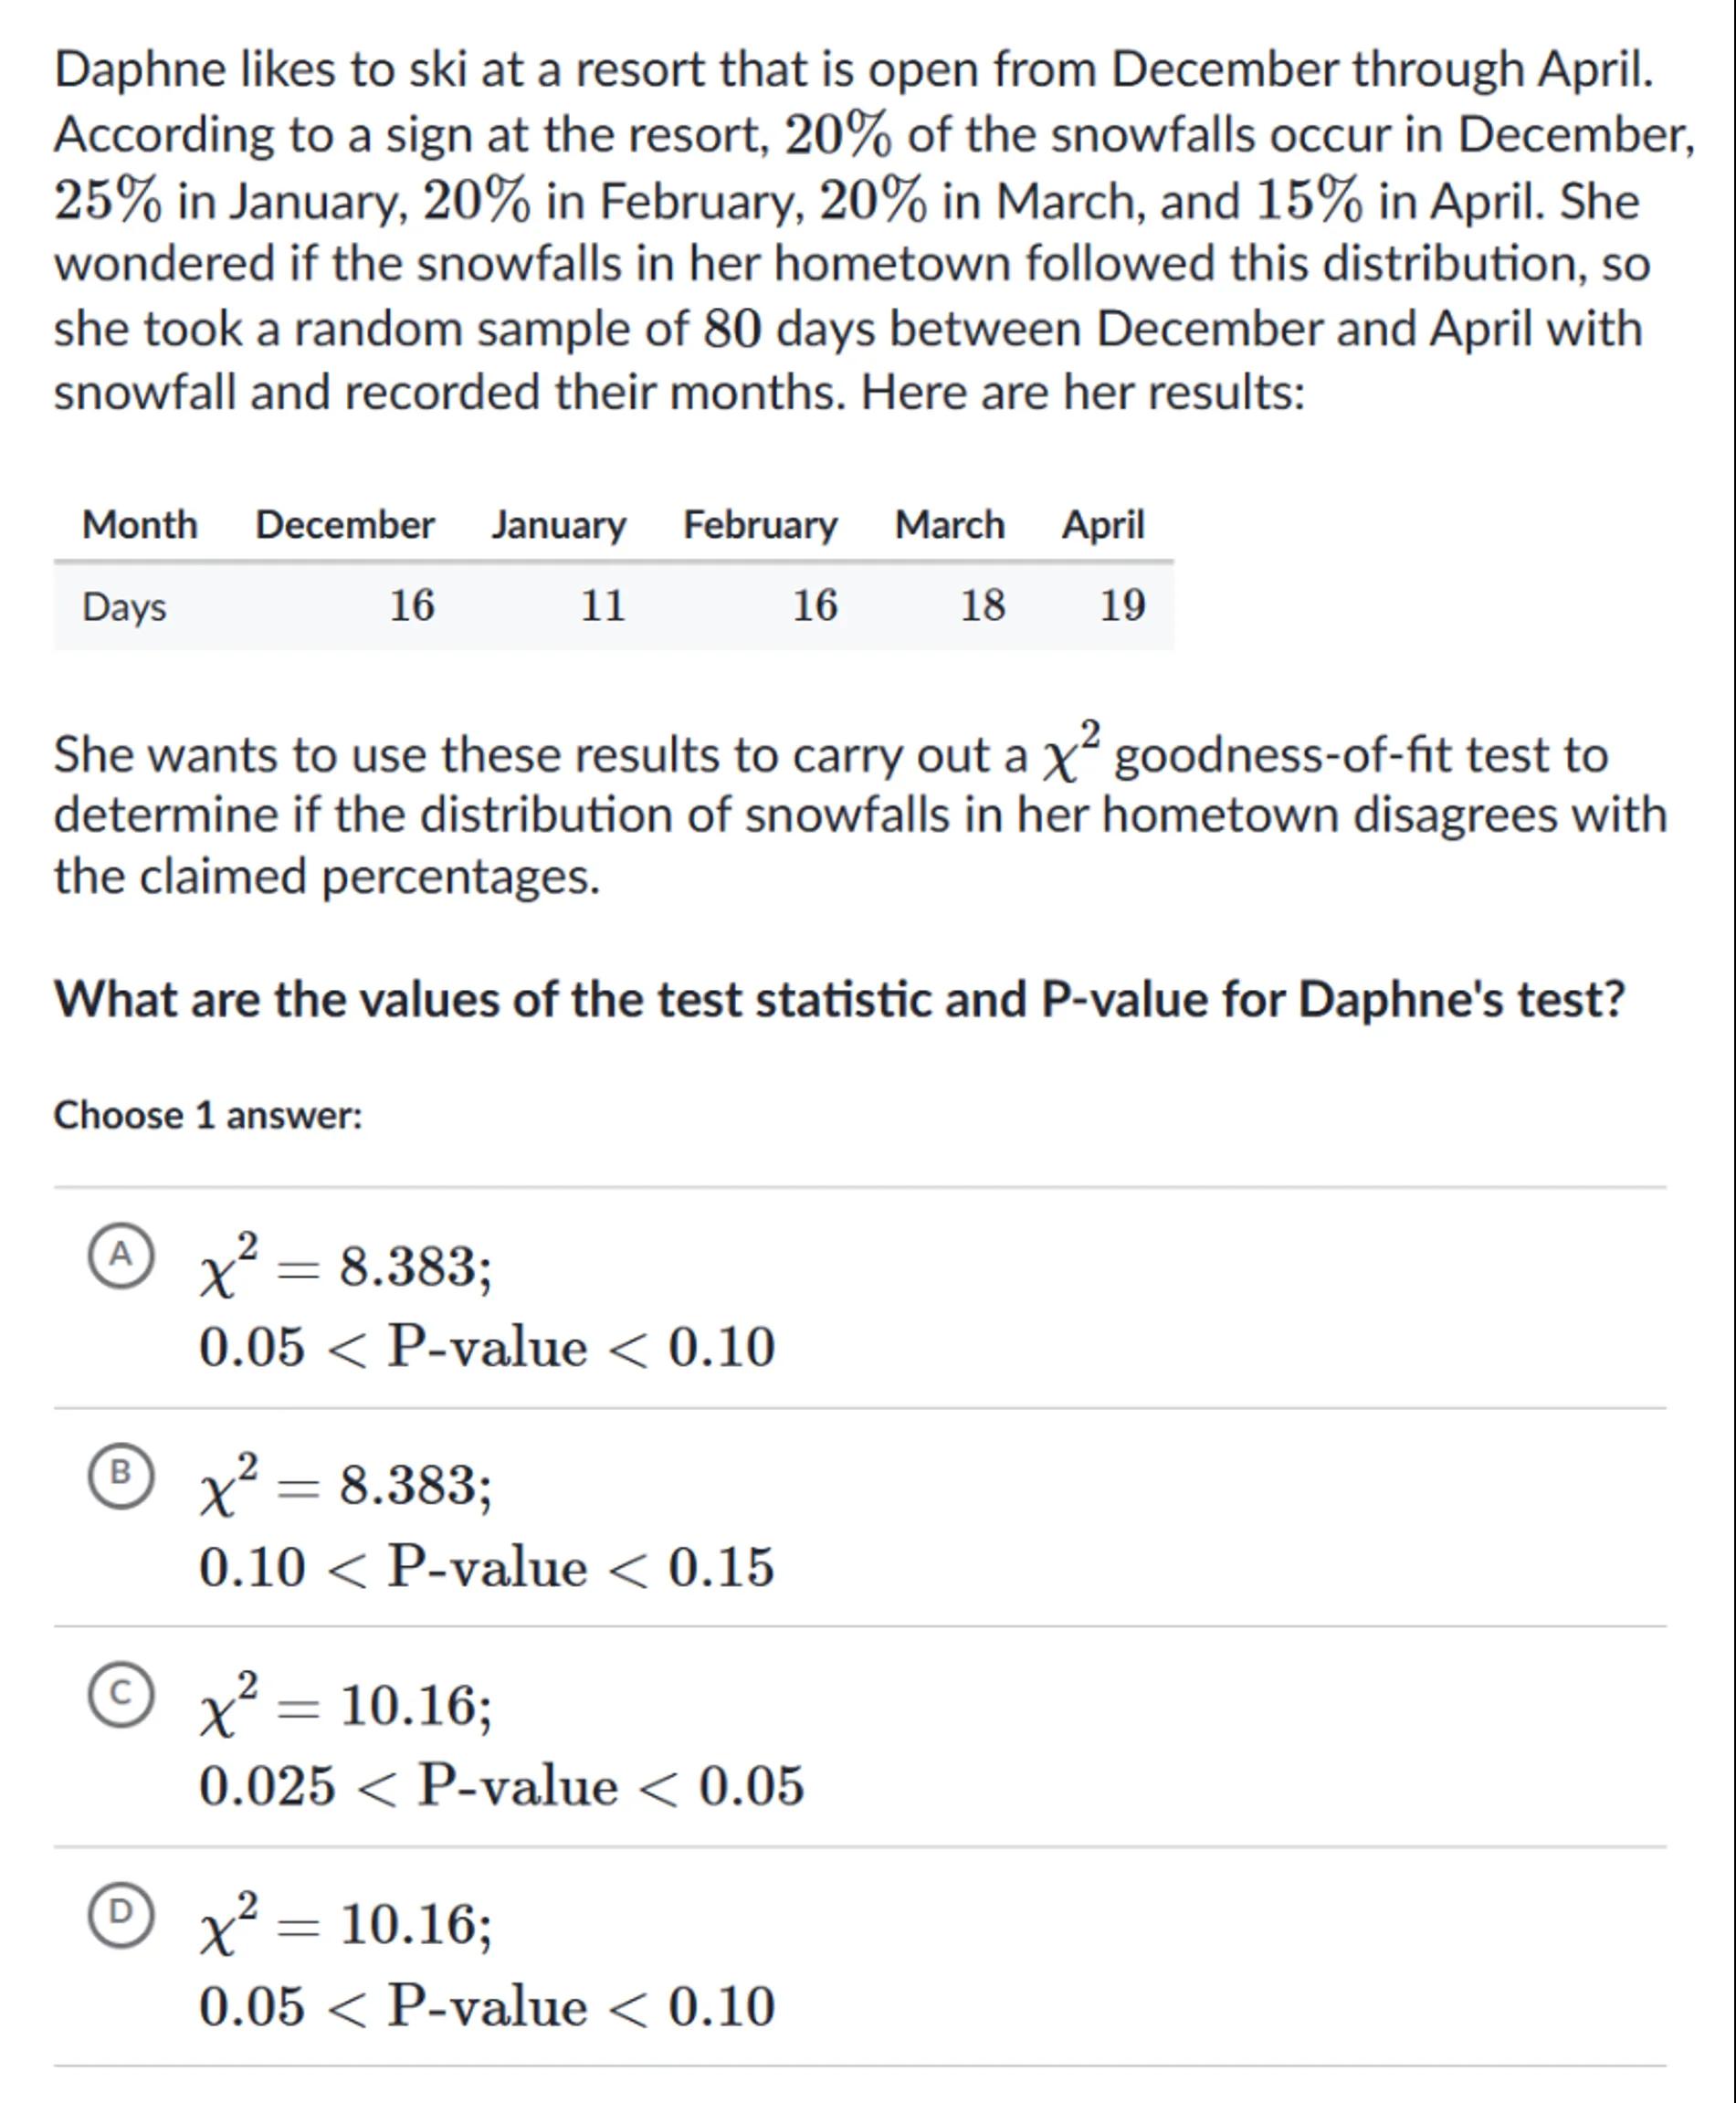
Daphne likes to ski at a resort that is open from December through April. According to a sign at the resort, of the snowfalls occur in December, in January, in February, in March, and in April. She wondered if the snowfalls in her hometown followed this distribution, so she took a random sample of 80 days between December and April with snowfall and recorded their months. Here are her results:
\begin{tabular}{lrrrrr}
Month & December & January & February & March & April \\
\hline Days & 16 & 11 & 16 & 18 & 19
\end{tabular}
She wants to use these results to carry out a goodness-of-fit test to determine if the distribution of snowfalls in her hometown disagrees with the claimed percentages.
What are the values of the test statistic and P-value for Daphne's test?
Choose 1 answer:
(A)
(B)
(c)
(D)
 Sign in to unlock the answer
Answer from Sia
Posted 10 months ago
Solution by Steps
step 2
Use the formula for the expected frequency:
step 3
For December,
step 4
For January,
step 5
For February,
step 6
For March,
step 7
For April,
step 8
Calculate the chi-square test statistic using the formula: , where is the observed frequency and is the expected frequency
step 9
For December,
step 10
For January,
step 11
For February,
step 12
For March,
step 13
For April,
step 14
Sum the values from steps 9 to 13 to find the total chi-square test statistic:
step 15
Determine the degrees of freedom, which is one less than the number of categories:
step 16
Use a chi-square distribution table or calculator to find the P-value corresponding to and
step 17
The P-value is less than 0.025, indicating that the observed distribution is significantly different from the expected distribution
1 Answer
C
Key Concept
Chi-square goodness-of-fit test
Explanation
The chi-square goodness-of-fit test is used to determine whether there is a significant difference between the observed frequencies and the expected frequencies in one or more categories.
Not the question you are looking for? Ask here!
Enter question by text
Enter question by image

Unlock Smarter Learning with AskSia Super!
Join Super, our all-in-one AI solution that can greatly improve your learning efficiency.
30% higher accuracy than GPT-4o
Entire learning journey support
The most student-friendly features

Study Other Question